
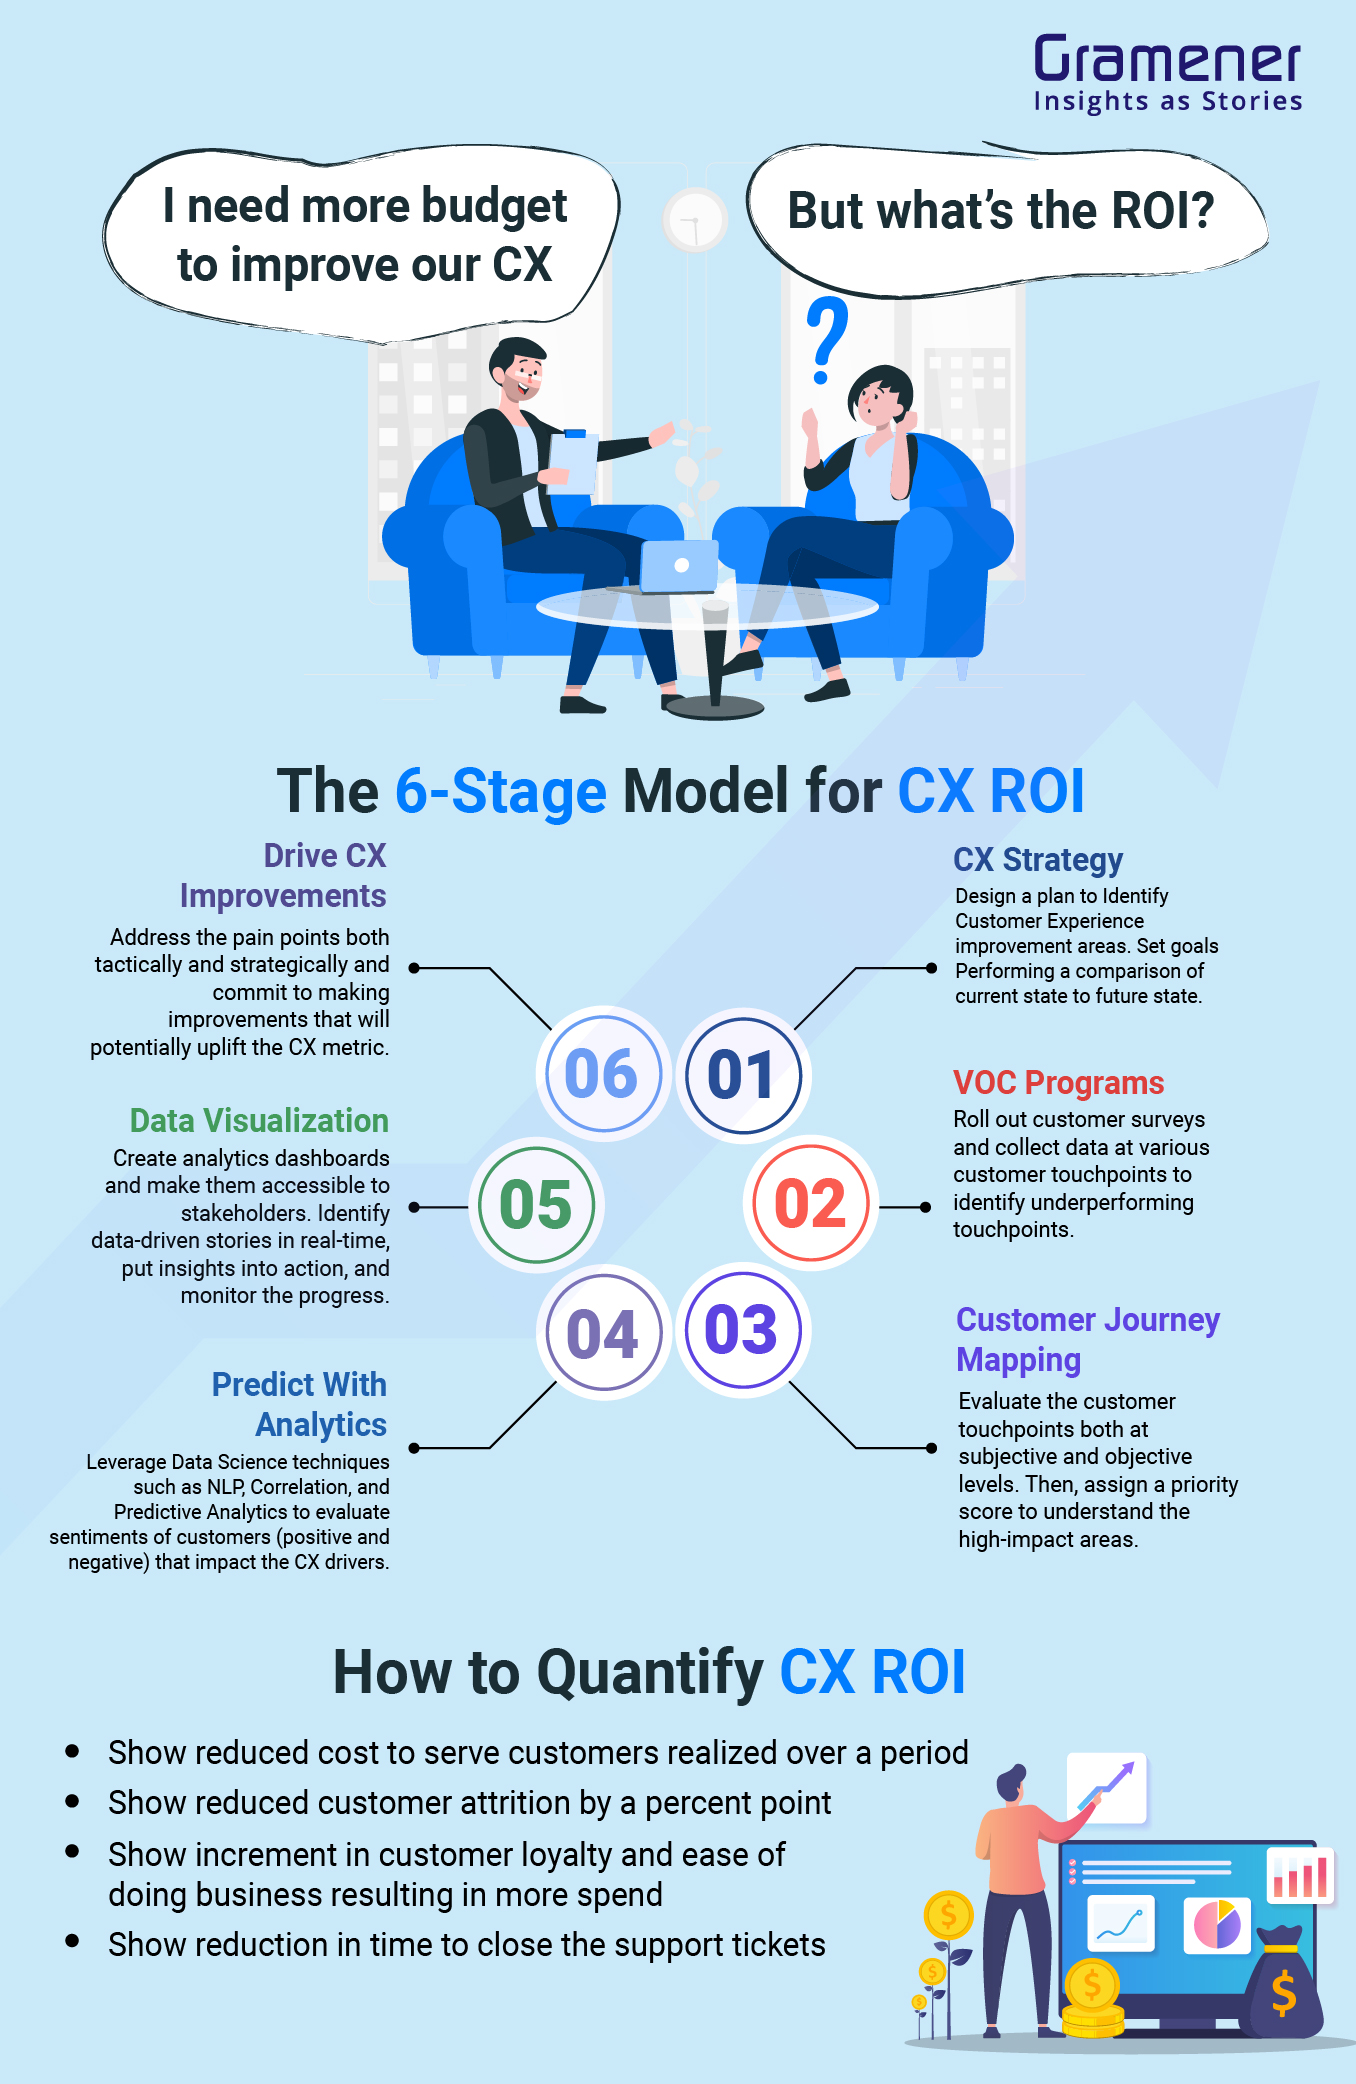
Defining digital CX ROI
For years, businesses have talked about "customer satisfaction’ as a goal. But in 2026, that"s simply not enough. The competitive market demands a quantifiable return on investment from every initiative, and digital customer experience is no exception. We need to move beyond surveys and anecdotal evidence to demonstrate how CX improvements directly impact the bottom line.
Traditional CX metrics like Net Promoter Score (NPS) or Customer Satisfaction (CSAT) offer limited insight into true business value. They can tell you if customers are happy, but not why or, more importantly, how that happiness translates into revenue. A high NPS score is great, but it doesn’t pay the bills. We need a framework that connects CX investments to tangible outcomes.
I believe the biggest misconception is that CX is a "soft’ metric. It’s not. It"s fundamentally about revenue growth, operational efficiency, and long-term customer loyalty. Viewing CX as an expense rather than an investment is a critical error. It's about creating experiences that drive desired behaviors – increased purchases, reduced support costs, and stronger brand advocacy.
The metrics that actually matter
Let’s move past vague notions of "customer happiness" and focus on metrics that directly correlate to business performance. While NPS still has a place, it should be considered a lagging indicator, not the primary measure of success. Instead, focus on metrics like Customer Lifetime Value (CLTV) increases, which demonstrate the long-term impact of improved experiences.
Lower churn is a better indicator. It costs five times more to find a new customer than to keep one. A platform is only useful if it stops people from leaving by fixing specific friction points. When more visitors actually buy something, the revenue increase is immediate.
Don't overlook the impact on average order value. Personalized recommendations and targeted promotions, powered by a Digital CX Platform, can encourage customers to spend more per transaction. Tracking these metrics, and how they change after implementing CX improvements, is essential. It's about demonstrating a clear link between CX investment and financial results.
- Customer lifetime value (CLTV): The total revenue a person brings in before they stop buying from you.
- Churn Rate: The percentage of customers who stop doing business with you over a given period.
- Conversion Rate: The percentage of website visitors or leads who complete a desired action (e.g., purchase, sign-up).
- Average Order Value (AOV): The average amount spent per transaction.
CX Measurement Tool Comparison: Effort vs. Insight
| Tool | Implementation Effort | Cost | Insight Quality | Best Use Case |
|---|---|---|---|---|
| Customer Surveys (e.g., Qualtrics) | Medium | Medium | Basic to Detailed | Gathering broad customer sentiment; targeted feedback on specific experiences. |
| Web Analytics (e.g., Google Analytics) | Low | Low | Basic | Understanding website traffic patterns and high-level user behavior. |
| Session Recording | Medium | Medium | Detailed | Identifying usability issues and understanding user journeys in real-time. |
| Heatmaps & Click Tracking | Low | Low to Medium | Detailed | Visualizing user interaction on web pages; identifying areas of interest/confusion. |
| Customer Data Platform (CDP) Integration | High | High | Detailed | Creating unified customer profiles and enabling personalized experiences. |
| CE 65 Analytics | Medium | Medium | Predictive | Proactive identification of CX friction points and opportunities for optimization; B2B and Retail focused. |
| A/B Testing Tools | Medium | Low to Medium | Detailed | Optimizing specific elements of the customer experience through controlled experiments. |
| Customer Journey Mapping Workshops | High | Medium | Detailed | Developing a holistic understanding of the customer experience across all touchpoints. |
Qualitative comparison based on the article research brief. Confirm current product details in the official docs before making implementation choices.
Connecting experience to revenue
Attribution has always been a challenge for marketers, but CX initiatives make it even more complex. Customers interact with your brand across numerous touchpoints – website, email, social media, chatbots – making it difficult to pinpoint which interactions are driving conversions. Traditional last-click attribution models are woefully inadequate in this environment.
Multi-touch attribution models are essential, but they’re not a silver bullet. They require sophisticated data analysis and careful consideration of weighting factors. I’m not convinced any single model can perfectly capture the customer journey. The complexity arises from how many different touchpoints a customer might have before converting, and the varying influence each touchpoint has.
Incrementality testing – a method of isolating the impact of a specific CX initiative by randomly exposing a control group to the change and comparing their behavior to a test group – is becoming increasingly important. This helps prove a causal link between your Digital CX Platform and revenue, rather than just a correlation. It’s about demonstrating that the investment caused the improvement, not that it simply coincided with it.
- Last-Click Attribution: Credits the last touchpoint before a conversion with the entire value.
- Multi-Touch Attribution: Distributes credit across multiple touchpoints based on various algorithms.
- Incrementality Testing: Isolates the impact of a specific initiative by comparing a control group to a test group.
Cutting costs through automation
Automation is where the money is. If you automate emails and basic support, you save hours of manual labor. I suggest starting with the high-volume, repetitive tasks that eat up your team's Tuesday afternoons.
However, the ROI goes beyond simply doing things faster. I think a lot of companies underestimate the hidden costs of manual processes. Time spent on manual data entry, resolving simple inquiries, or chasing down customer feedback adds up quickly. Automation frees up your team to focus on higher-value work – strategic initiatives, complex problem-solving, and building stronger customer relationships.
Consider the impact of automated chatbots on support costs. By handling common inquiries 24/7, chatbots can reduce the workload on your support team, allowing them to focus on more complex issues. This not only reduces costs but also improves customer satisfaction by providing faster response times.
- Personalized Email Campaigns: Automated emails triggered by specific customer behaviors.
- Chatbot Interactions: 24/7 support and instant answers to common questions.
- Proactive Support: Identifying and addressing potential issues before customers experience them.
Automated CX Tasks & Potential Savings
- Personalized Email Follow-Ups: Automating tailored email sequences based on customer behavior (e.g., abandoned carts, website visits) can significantly reduce manual effort. Estimated time savings: 8-12 hours per week for a mid-sized sales team.
- Support Ticket Triage & Routing: Intelligent systems can categorize incoming support requests using Natural Language Processing (NLP) and route them to the appropriate agent or department. Estimated time savings: 6-10 hours per week for a support team handling 50+ tickets daily.
- Proactive Chat Offers: Triggering chat windows based on website visitor behavior (e.g., time on page, specific page visited) allows for real-time assistance. Estimated time savings: 4-8 hours per week by reducing reactive chat volume and improving first-contact resolution.
- Automated Feedback Collection: Deploying surveys (e.g., Net Promoter Score (NPS), Customer Satisfaction (CSAT)) automatically after key customer interactions streamlines feedback gathering. Estimated time savings: 3-5 hours per week in manual survey distribution and data compilation.
- Knowledge Base Content Updates: Identifying trending support topics and automatically suggesting knowledge base article updates or creation can keep self-service resources current. Estimated time savings: 2-4 hours per week for knowledge base administrators.
- Lead Scoring Automation: Assigning points to leads based on demographics, behavior, and engagement levels helps prioritize sales efforts. Estimated time savings: 5-8 hours per week for sales development representatives.
- Customer Segmentation: Automatically grouping customers based on shared characteristics allows for targeted marketing and personalized experiences. Estimated time savings: 4-6 hours per week for marketing teams, enabling more efficient campaign targeting.
B2B vs. Retail: Different ROI Drivers
The calculation of Digital CX Platform ROI differs significantly between B2B and retail contexts. In B2B, the sales cycle is longer, and the value of each customer is typically higher. Therefore, ROI is often measured in terms of account expansion, contract renewal rates, and lead quality. Improving the B2B customer experience can lead to larger deals and longer-term relationships.
For retail, the focus is often on repeat purchases, average order value, and customer acquisition cost. A seamless and personalized online experience can drive repeat business and encourage customers to spend more per transaction. Reducing friction in the purchase process is paramount. I've seen companies focus so much on acquisition they forget to nurture the customers they already have.
I suspect we'll see more convergence between these two approaches as B2B companies adopt more retail-inspired CX strategies. Account-Based Marketing (ABM), for example, borrows heavily from retail personalization techniques. The underlying principle remains the same: delivering relevant, valuable experiences to drive desired outcomes.
How CE 65 tracks impact
CE 65 is designed to help businesses achieve measurable ROI from their Digital CX initiatives. Our Analytics suite provides a comprehensive view of customer behavior, allowing you to identify pain points and opportunities for improvement. We don’t just collect data; we help you turn that data into actionable insights.
Our automation capabilities enable you to personalize experiences at scale, delivering the right message to the right customer at the right time. This drives engagement, increases conversion rates, and fosters stronger customer loyalty. CE 65 integrates seamlessly with your existing systems – CRM, marketing automation, and more – to create a unified customer view.
We focus on providing the tools and insights you need to address the challenges discussed earlier – accurate attribution, efficient automation, and a clear understanding of your customer’s needs. We aren’t trying to sell you a platform; we’re partnering with you to drive tangible business results. We believe in demonstrating value, not just promising it.
- CE 65 analytics: Dashboards that show where people are getting stuck in your checkout flow.
- Automation Capabilities: Personalized email campaigns, chatbot integrations, and proactive support.
- Seamless Integration: Connects with your existing CRM, marketing automation, and other systems.

No comments yet. Be the first to share your thoughts!